Foam plastic insulation is created by use of a blowing agent to produce a reduced-density plastic containing voids consisting of closed or open cells. For expanded polystyrene (EPS), these voids are filled with air, and for extruded polystyrene (XPS) these voids are filled with a blowing agent (other than air). Both improve thermal resistance but to different degrees. The common question when designing with XPS is as follows:
How does one account for the reduction in R-value due to the gradual loss of blowing agent over time periods, i.e., how does one account for aging, or long-term thermal resistance?
Walk-in coolers and freezers represent one application with a life span of approximately 15 years. These have been characterized as having a service life between 12 and 25 years1, depending on maintenance and handling of materials within the unit. This application raised an important line of inquiry concerning long term thermal resistance (LTTR):
- What aging effects on XPS R-value should be applied for the insulated panels in the unit?
- Should the designer assume all the blowing agent will dissipate, causing the LTTR of XPS to become the same as typical EPS R per inch values?
- Or does most of the blowing agent used in XPS remain in the closed cells?
Fortunately, there are laboratory test methods designed to evaluate this characteristic in the worst-case scenario where the foam is fully exposed to open air.
Laboratory Practices for Estimating Long-Term Thermal Resistance
It would be impractical to have manufacturers wait decades to establish the LTTR by actual aging and direct measurement. Alternatively, researchers have developed a short-term test method that accurately estimates a five-year predicted thermal resistance, which then is used to extrapolate 15-year design life thermal resistance, according to fundamental principles of diffusion theory and related mathematics.
The design life thermal resistance is not only the predicted performance at 5 years but also is the average thermal resistance over the entire 15-year service life.
The Canadian and US markets independently developed laboratory standard methods that determine LTTR. For Canada and the United States, these test methods are described in CAN/ULC S770 and ASTM C1303, respectively. CAN/ULC S770 defines LTTR as the value measured after five-year storage in a specific laboratory environment. It provides a means for predicting LTTR based on a methodology that combines accelerated aging with laboratory testing. The Canadian and US standards both produce five-year LTTR prediction estimates. Both methodologies rely on specifically prescribed aging of laboratory-sliced foam samples without any adjacent material next to the foam slices. In both methodologies, all six sides of the foam slices allow freely circulating air in the laboratory.
LTTR Methodologies: What They Do and Don’t Measure
The LTTR tests measure the effects on R-values from changes in the concentration of blowing agents and air within the closed cells of rigid foam insulation. LTTR tests and methodologies do not address the effects of other environmental factors, such as moisture and temperature,
which should be considered separately from a design perspective. At the time of manufacturing, initial R-values of XPS foam insulation are high. That’s due in part to the high concentration of high-molecular-weight blowing agents trapped within the closed cells. This initial R-value gradually decreases over a period of years, depending on several factors that include adjacent materials (such as metal skins or soil) and other environmental conditions acting on the closed cells, such as temperature and humidity.
What Impacts LTTR the Most?
The rate or speed at which the blowing agent diffuses out of XPS cells is important factor in estimating LTTR. Faster diffusion leads to a lower LTTR. If the rate of diffusion is slow, then the initial R-value without aging will be nearly the same as the LTTR with aging. Conversely, if the rate of blowing agent diffusion is fast, then the LTTR value will deviate significantly from the initial R-value.
The least diffusion occurs when:
- The XPS product is in direct contact with facers/substrates having a low permeance that restricts the egress of blowing agent, and
- The XPS product is kept at a constant low temperature.
An example is walk-in coolers and freezers. The US Department of Energy found that, for walk-in coolers and freezers, XPS panels sold with metal facers that remain attached to the foam showed minimal loss of thermal resistance, and testing for LTTR could be ignored2. The greatest diffusion occurs on very thin product, directly exposed to open air, and without adjacent materials to slow diffusion. That’s why LTTR testing requires XPS to be sliced into thin pieces to accelerate diffusion. Thinner XPS will have greater blowing agent diffusion than thicker XPS under the same environmental conditions.
Where to Find LTTR Values
XPS product specification or classification standards require LTTR to be determined and reported regardless of the intended application. Accordingly, it is the buyer’s responsibility to specify design requirements and obtain supporting LTTR documentation from the supplier. In the US, ASTM specification standard C578 requires that manufacturers measure and report ASTM C1303 LTTR values only for Types IV, V, VI, VII and X. ASTM C578 does not specify that LTTR be labeled on the product. The Canadian XPS product classification standard, however, requires CAN/ULC-S770 LTTR labeling on the product. The LTTR information is also listed in publicly available third-party evaluation reports.
Comparing LTTR with Initial R-values
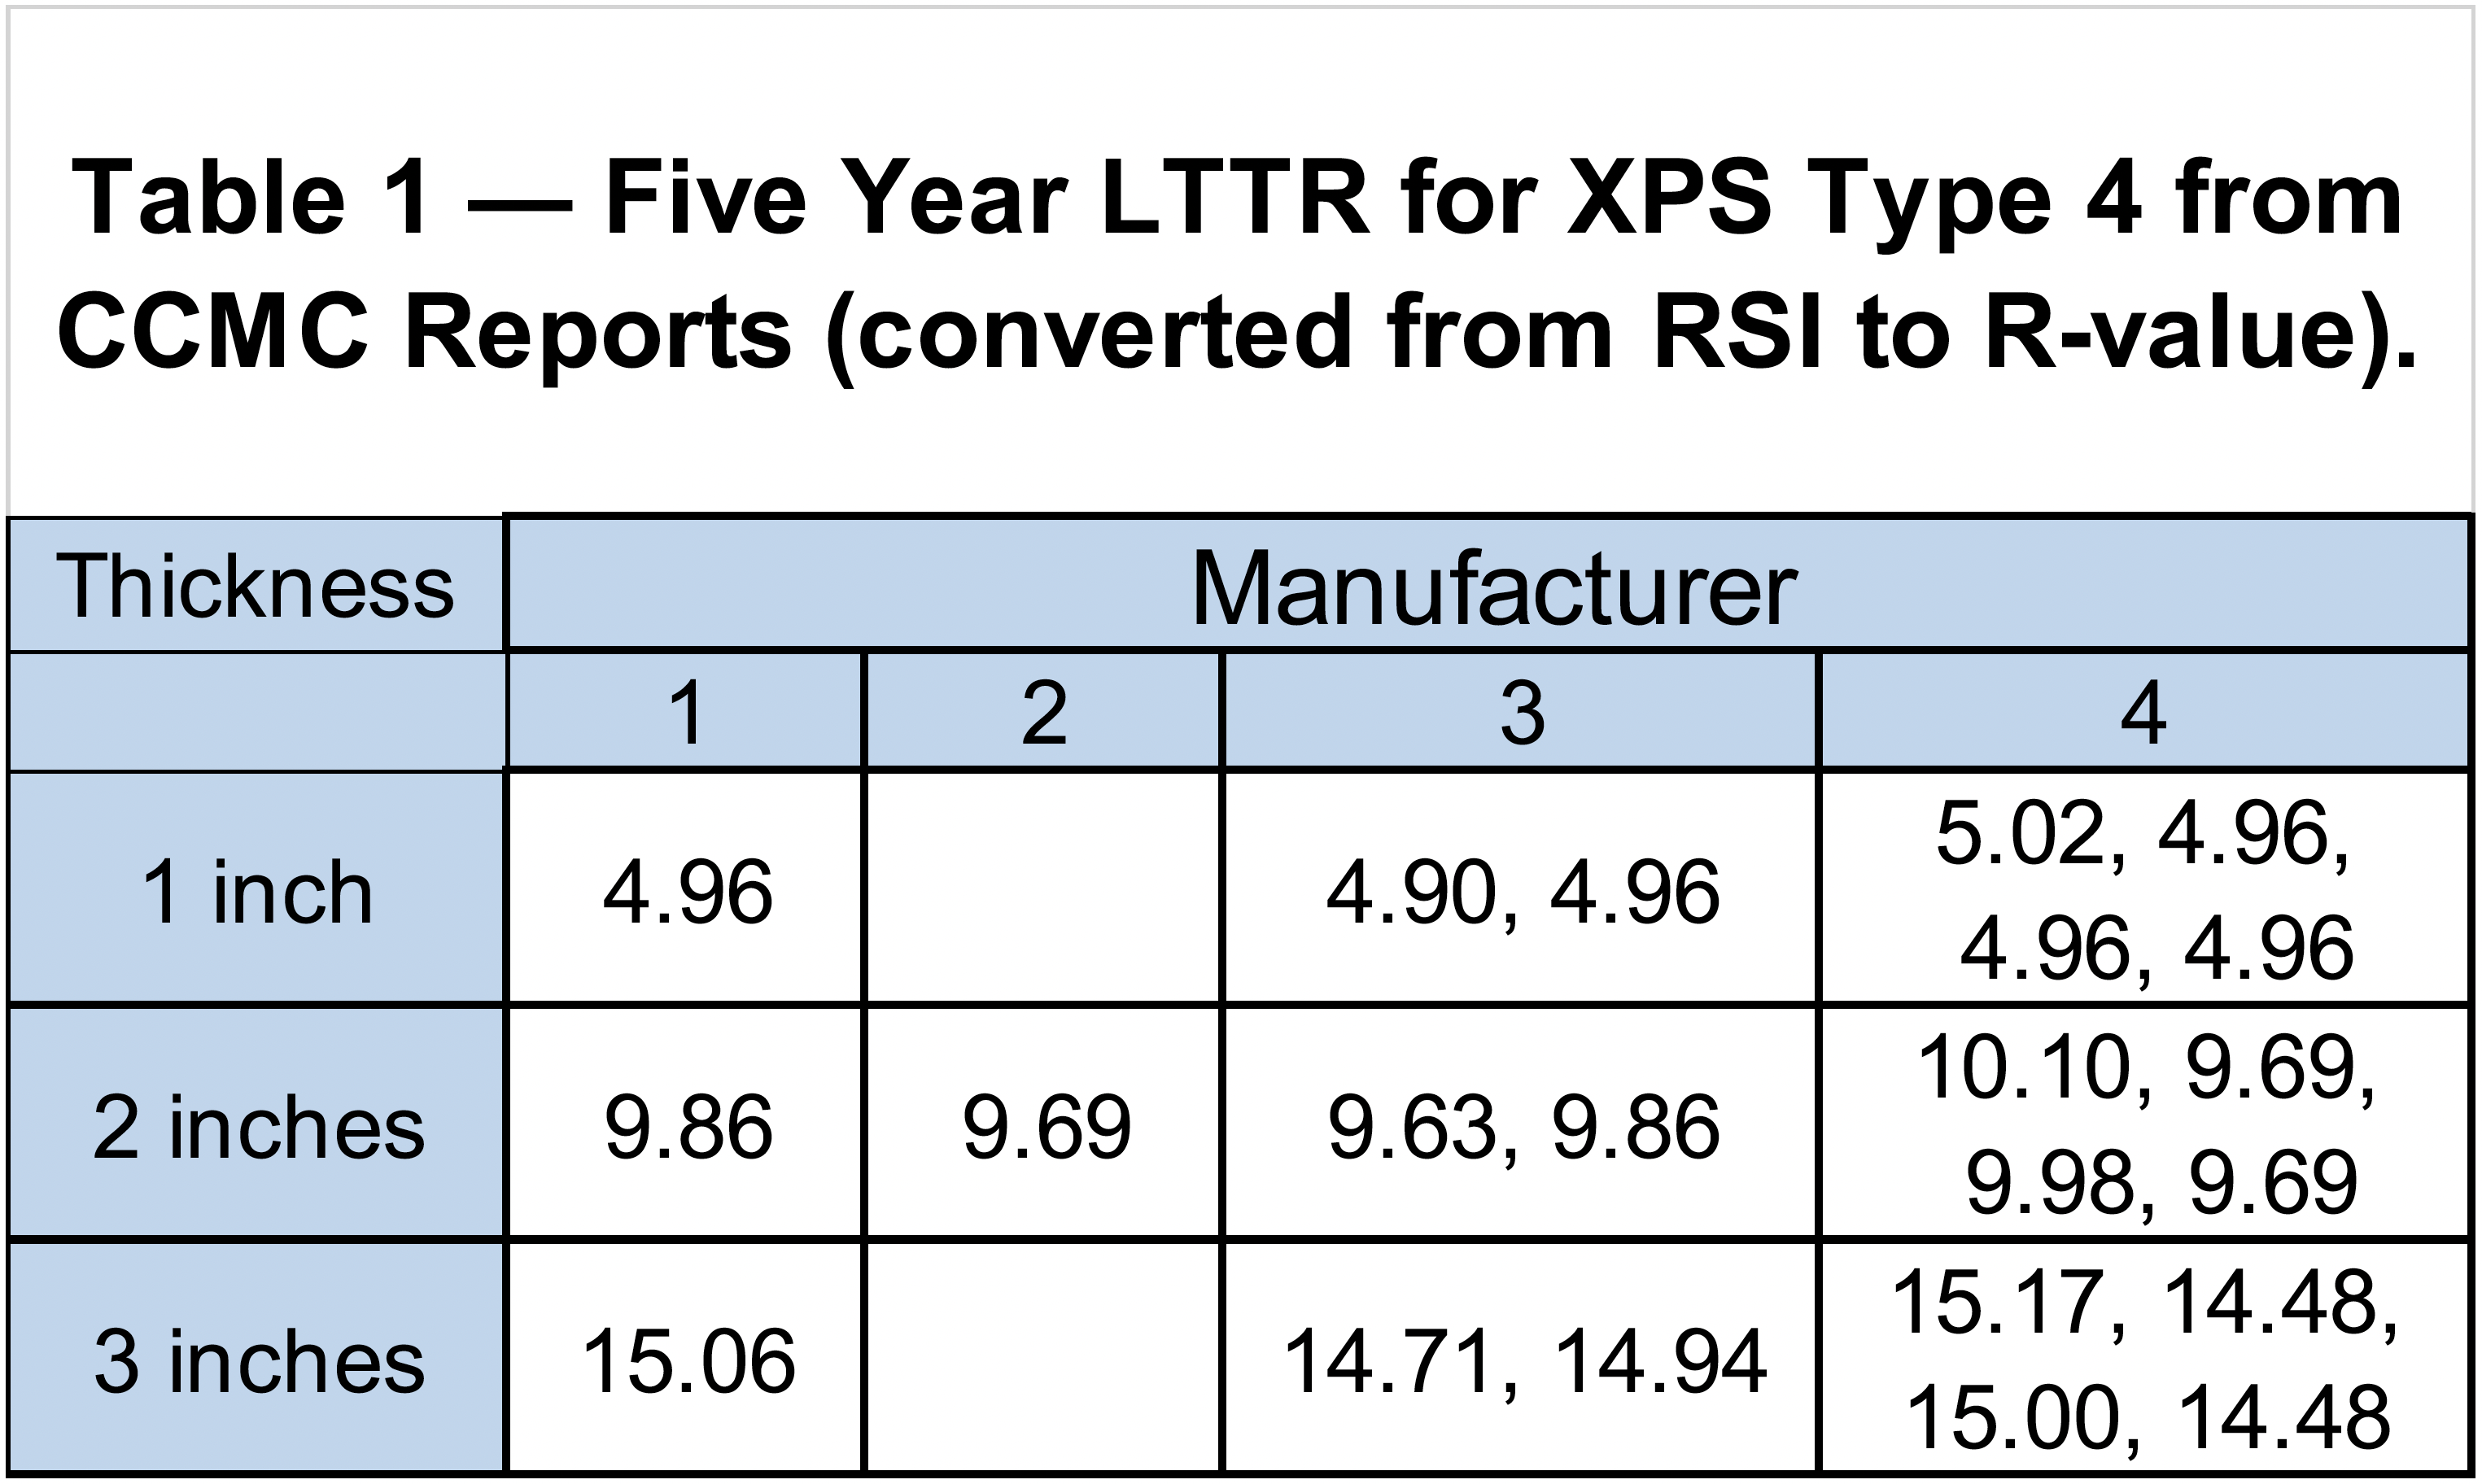
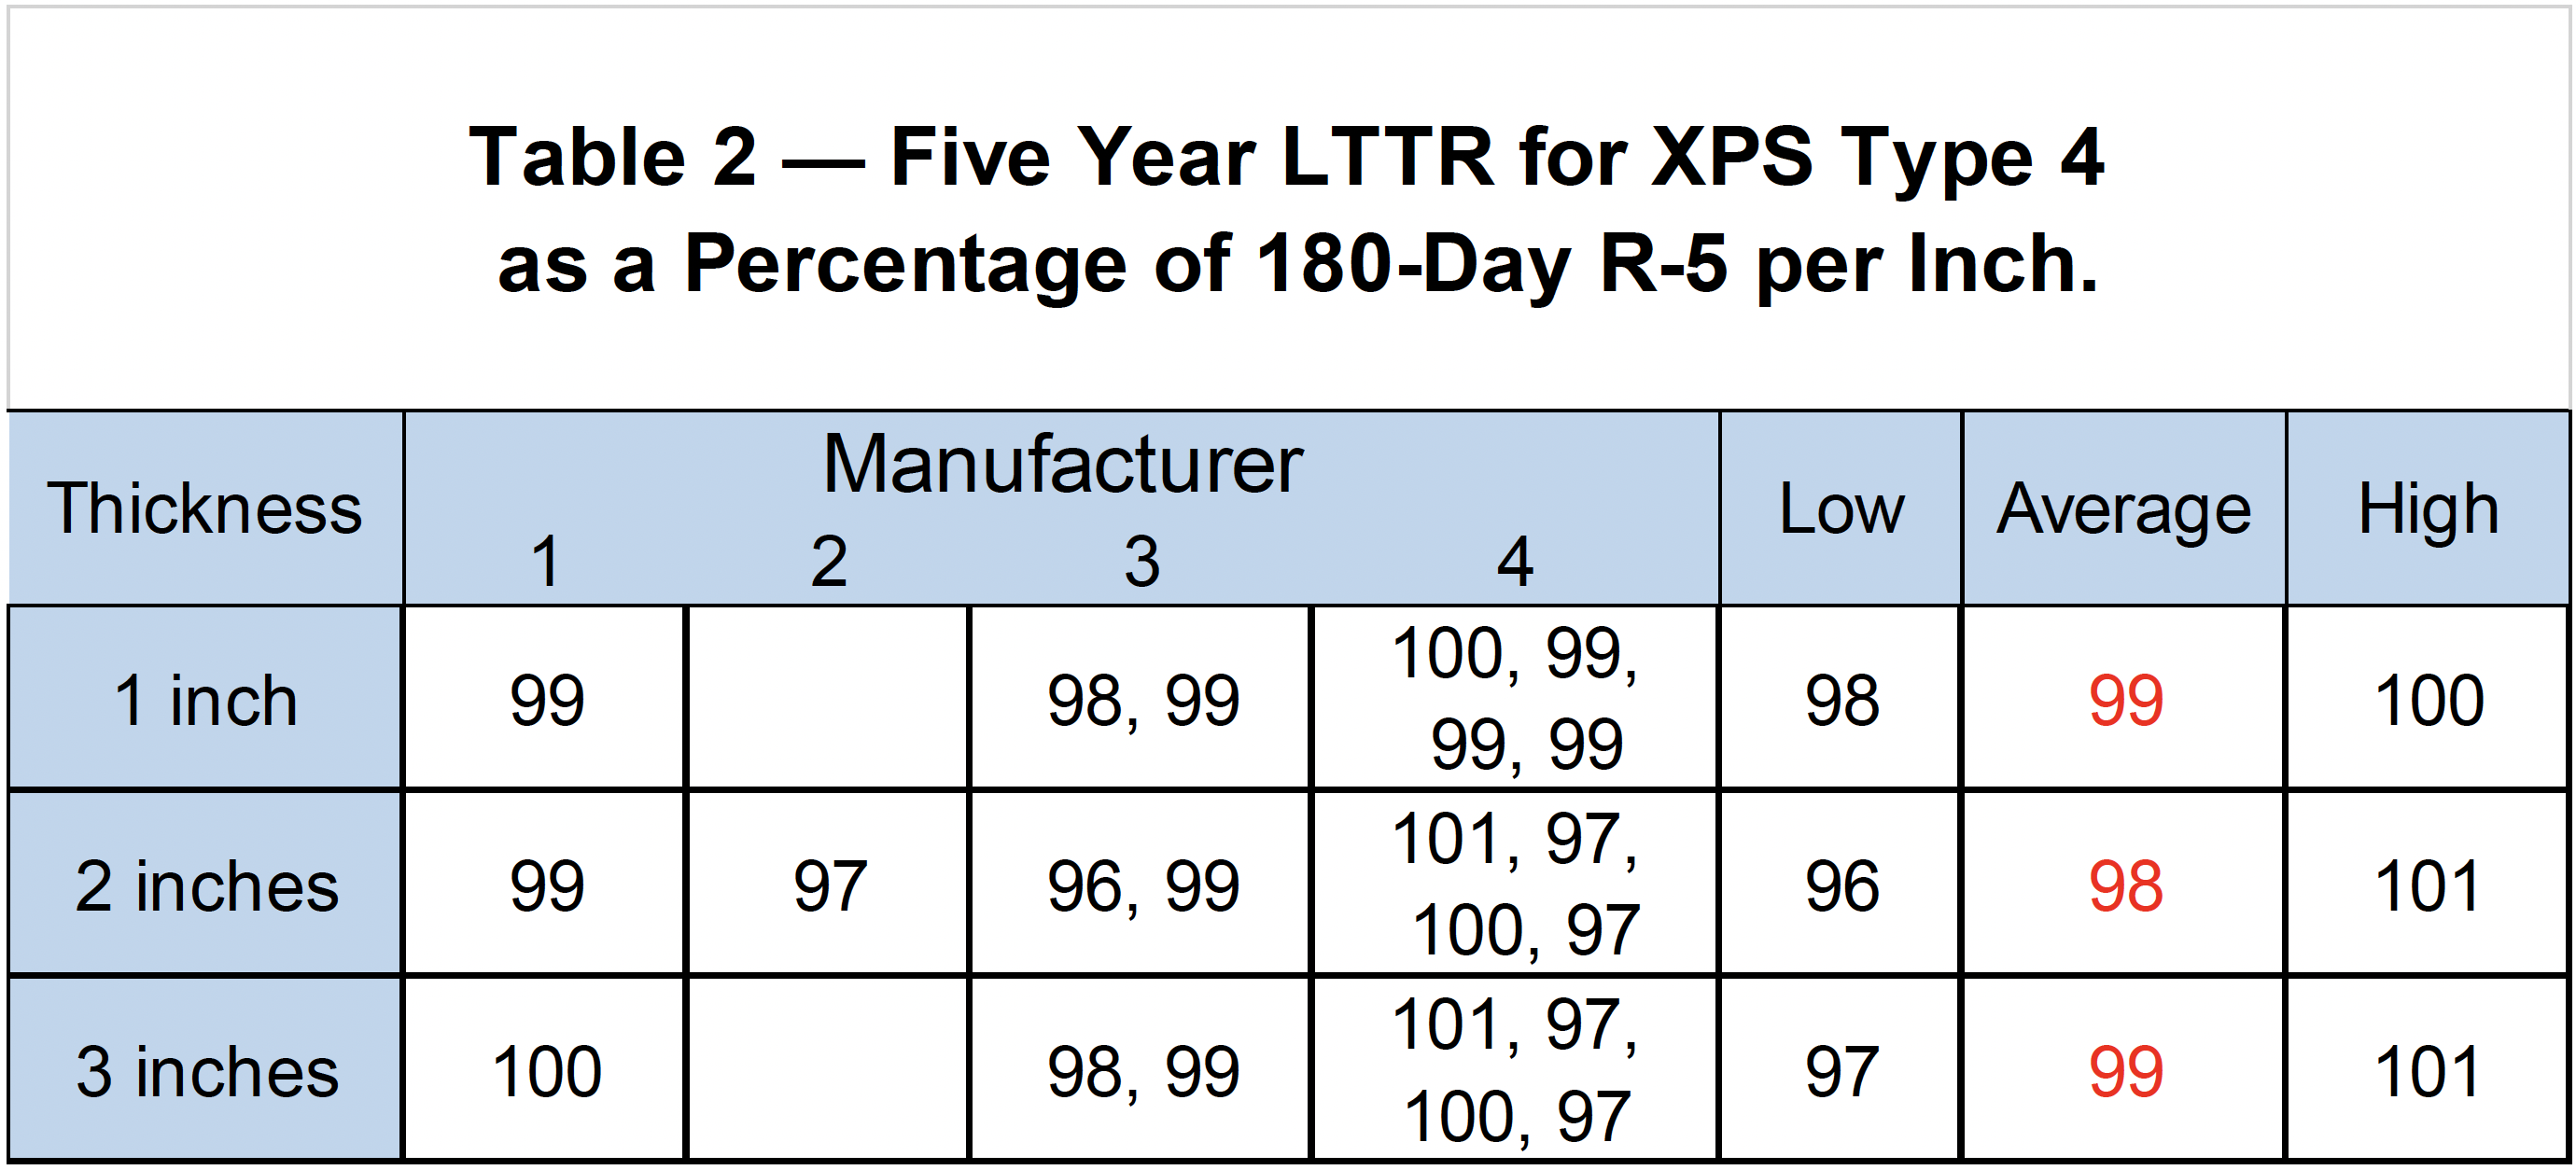
This fact sheet compares the Canadian 180-day (ambient aging) XPS R-values with the five-year XPS LTTR values, using published information from third-party evaluation reports. Table 1 lists declared LTTR values from four different XPS manufacturers as reported to the Canadian Construction Materials Centre (CCMC) as of July 2023. Table 2 expresses the LTTR values as a percentage of R-5 per inch (i.e., 180-day R-values). The five-year LTTR values are 99 percent of the declared 180-day R-value. In other words, over a 4.5-year period, the XPS R-value drops only one percent, indicating a slow rate of diffusion.
In practicality, a one percent drop in R-value is insignificant for building envelopes. For example, the variation of the LTTR measurement (i.e., the variation within laboratories and equipment) is greater than the one percent difference in R-value between 180 days ambient aging and the five-year values determined by LTTR methodologies. In other words, the changes in the concentration of gases are not significant from a design
standpoint and are within normal manufacturing tolerances. The designer will get similar results regardless of whether he elects to use the 180-day without aging R-value or the five-year LTTR value. This finding raises another important question: Given that the 180-Day and 5-Year LTTR are similar, how is a 15-year design life thermal resistance for aging determined?
15-Year Design Life R-values
The 180-day and 5-Year LTTR R-values are declared R-values at points in time. Technically, neither is a time-weighted average to account for a 15-year service life. The time-weighted, 15-year average must account for the declining R-value over long periods of time.
Interestingly, however, according to ASTM 1303, the 5-year LTTR measurement also serves as the 15-year time-averaged performance. This is based on diffusion theory. The rate of diffusion is faster early on and slows down with time since the concentration gradient decreases with time. A time-weighted average estimates that the first third of the 15-year life span will have above average R-values and the remaining two-thirds of the 15-year life span will have below average R-values3. Consequently, as an excellent approximation, the time-weighted average for 15 years (combining the five-year period with the subsequent ten years) has the same R-value performance as the 5-year LTTR.
In other words, the measured five-year XPS LTTR value is equal to the time-weighted 15- year design life thermal resistance. Simply put, the 5-year measurement point also serves as the 15-year average performance.
Despite competitor claims to the contrary, XPS aging does not degrade the insulation to the point where all the blowing agent is released during this 15-year period. Quite the opposite, the LTTR values show the blowing agent remains effective. XPS continues to outperform EPS over the design lifespan, especially when considering aging.
The designer will need to decide whether to use the 180-day R-value without aging (R-5 per inch, or 100 percent) or the LTTR value (R-4.96 per inch, or 99 percent) as the 15-year design Rvalue. The Extruded Polystyrene Association (XPSA) believes the manufacturing tolerances permitted for all polystyrene (XPS and EPS) exceed the XPS aging effects.
Comparison with Manufacturing Tolerances
Manufacturing tolerances have much more influence on the variation of R-value than the one to two percent LTTR reductions listed in Table 2. The following examples are for one-inch thick XPS.
Thickness tolerance. ASTM C578 allows for up to ± 6 percent of nominal thickness for both EPS and XPS. R-value is proportional to thickness; thus, a delivered product could perform as follows:
- Assuming R5.0/in. and ± 6 percent tolerance on thickness, a nominally “1-inchthick” sample of Type X XPS could range from R4.7 to R5.3 based on the allowable thickness tolerance.
- Assuming R4.3/in. and ± 6 percent tolerance on thickness, a nominally “1-inchthick” sample of Type XIV EPS could range from R4.0 to R4.6 based on the allowable thickness tolerance.
- Similarly, in-service physical compression of the foam (which reduces the thickness) proportionately reduces the EPS or XPS thermal performance. The range of permitted thickness and in-service compression should be accounted for in EPS and XPS design.
Note: CAN/ULC S701.1 allows for up to minus 8 percent to plus 16 percent of nominal thickness for both EPS and XPS. A declared R-5/in. product (without accounting for aging) could perform between 4.6 and 5.8/in., depending on actual thickness at the time of delivery.
Temperature fluctuation in service. Type X XPS is expected to have a minimum R-value of 4.65/in. at 110 °F and 5.4/in. at 40 °F according to ASTM C578 Table X1.2. These values are, respectively, − 6 percent and + 6 percent of R-5/in (a minimum value required at 75 °F). The range of in-service temperatures should be considered in design. The temperature effects are similar in both US and Canada.
Moisture fluctuation in service. A very small amount of water absorption, on a volume percentage basis, significantly reduces the thermal resistance of any insulation. The effects of water absorption on thermal resistance of foam insulations are well documented. The excellent XPS resistance to water absorption is also well documented. The range of in-service moisture should be considered in design. The moisture effects on R-value are similar in both US and Canada, but the climate zone characteristics to which the insulation is exposed are different.
Declared versus actual R-values for individual specimens. The FTC R-value rule 16 CFR 460 applies to all residential insulation sold in the United States. The rule states information on product tolerances in Section V.D.2 that “the actual R-value of any insulation sold to consumers cannot be more than 10 percent below the R-value shown on a label, fact sheet, ad, or other promotional material for the product …. In addition, the Rule would continue to specify that no individual specimen of that insulation may have an R-value more than 10 percent below the R-value shown in a label, fact sheet, ad, or other promotional material for that insulation.” The variability of individual R-values should be accounted for in design. There is no equivalent Canadian rule.
Practical Design
LTTR methodologies do not address environmental factors such as moisture and temperature. Such factors should be considered separately, from a design perspective. There is no significant impact of XPS cell gas-aging over 15 years on long-term design thermal resistance within the common XPS thickness range of one to three inches, regardless of adjacent facers or substrates.
XPSA members believe that LTTR is within, not in addition to, the insulation manufacturing tolerances for a design criterion of 15 years as a required disclosure in Canada.
A one- to two-percent change in R-value due to aging is within the six- to ten-percent ranges of allowable tolerances for individual R-value performance due to thickness variability (−8/+16 percent), compression and individual specimen variability. Furthermore, the accuracy of building design parameters as well as the precision and bias of the insulation R-value measurements themselves are not accurate to within a one- to two-percent range.
Designers should anticipate that, for any insulation product, a variation of ± 3-8 percent of declared R-value is not unreasonable and should adjust their designs accordingly. Moisture absorption has the greatest impact on design thermal resistance. XPSA members believe that LTTR is within, not in addition to, the insulation manufacturing tolerances for a design criterion of 15 years as a required disclosure in Canada. It is the responsibility of the designer to account for product tolerances, variation and the accuracy of design parameters to ensure that the insulation product once installed will perform as intended.
1 National Technical Reports Library. View Here
2 Federal Register / Vol. 88, No. 86 / Thursday, May 4, 2023 / Rules and Regulations
DEPARTMENT OF ENERGY 10 CFR Parts 429 and 431 [EERE–2017–BT–TP–0010] RIN 1904–AD78 Energy Conservation Program: Test Procedures for Walk-In Coolers and Walk-In Freezers
AGENCY: Office of Energy Efficiency and Renewable Energy, Department of Energy.
ACTION: Final rule.
3 The equivalence of the 5-year LTTR to a 15-year design life is based on standards committee discussions. The Canadian Plastics Association and foam plastic manufacturers define LTTR as the “time-weighted” average of thermal resistance over 15 years at a given thickness. This “time-weighted” average thermal resistance was discovered to be equal to the R-value estimated at a reference time of 5 years, which is equivalent to a 15-year service life.